")
")
2 photon excitation Fluorescence Correlation Spectroscopy Microscopies
Associated to the group of Cathy Royer
1- Fluorescence Correlation and Cross Correlation Spectroscopy (FCS & FCCS)
2- Raster Imaging Correlation Spectroscopy (RICS)
3- Number and Brightness analysis (N&B)
and give information in vitro and in vivo on:
- Diffusion Coefficients
- Molecular Concentrations
- Molecular interactions.
- Processes of diffusion and binding
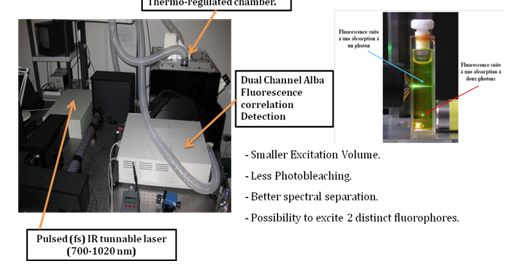
Our setup
|position |dichroic |filter CH1 |filter CH2|
|1 |Empty |Empty |Empty|
|2 |Empty |525/70m-2p |500/100|
|3 |580 LP |675/50 |Empty|
|4 |565 LP |653/95 |525/70m-2p|
|5 |565 LP |610/75 |Empty|
Others dichroic and filters available: 565 LP//empty// 525/50; 630 LP//empty// 585/40 and 505dcxr//empty//HQ455/100.
Further information on the different FCS techniques
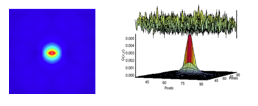
2 Photons excitation provides both high axial resolution and extremely small detection volume, on the order of 0.1 fL. Therefore, 2 PE microscopy ensures that no photo damage happen outside the excitation volume but also a better spectral separation and the possibility to excite 2 distinct fluorophores.
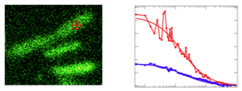
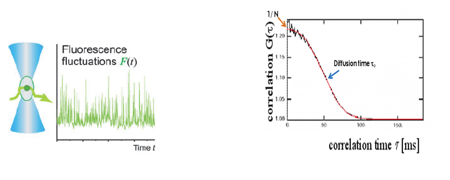
Fluorescence Correlation Spectroscopy (FCS) is based on the observation of the amplitude and speed of fluorescence fluctuations with time occurring in the small excitation volume. The FCS experiments are performed on samples at nanomolar range concentrations so that very few fluorescent molecules diffuse in and out of the laser beam giving rise to important fluctuations. The rate of fluctuation depends on the rate of fluorophore diffusion and the height of the curve is inversely proportional to the average number of fluorophores being observed. 
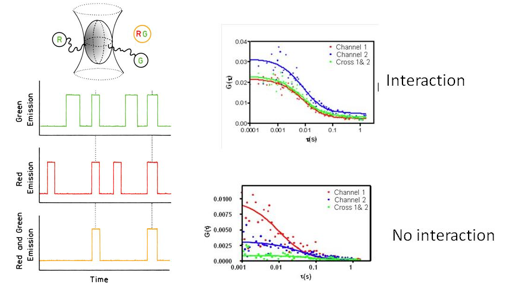
Fluorescence Cross-Correlation Spectroscopy (FCCS) is based on detection of diffusing molecule labeled with 2 different colors. If a Green molecule diffuses into the volume excitation there is a burst of photons in the Green channel, and similarly for a Red molecule into the Red channel. If these two molecules interact with each other, they will co-diffuse into the excitation volume and a burst of Green & Red photons is observed in both channels at the same time.  
Scanning FCS techniques: Point FCS experiments often come with photo-bleaching problems of the sample and can damage the cells. Therefore, different scanning FCS techniques have been developed to avoid damaging samples. Scanning FCS is a powerful method for accurate measurements of slower diffusion and binding events with notable advantages: i) Less photo damage of the cells; ii) Multiple points FCS simultaneously; iv) Distinguish moving from immobile fraction; v) Spatial cross correlation. Among these scanning FCS techniques we offer Circular Scanning FCS, Raster Imaging Correlation Spectroscopy (RICS) and Number & Brightness (N&B)
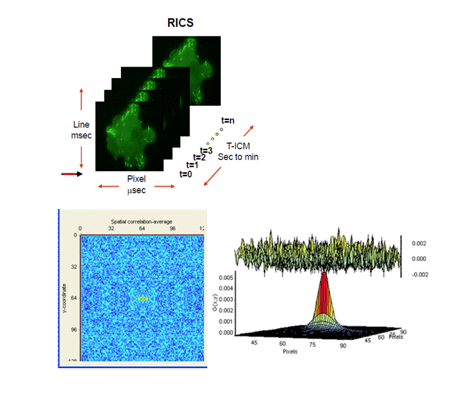
RICS was developed by Digman M. and Gratton E. You can refer to the PDF file here. http://www.lfd.uci.edu/workshop/2009/files/LFDWorkshop2009-Lecture04.pdf RICS extract information about the molecular diffusion and concentrations from raster scan images of living cells. As the laser performs the raster scanning movement, it creates a space-time matrix of pixels within the image. Therefore, the images contain information on the microsecond time-scale for pixel to pixel on the horizontal scanning axis, millisecond time scale along the vertical scanning axis and on the second time-scale between successive images. 
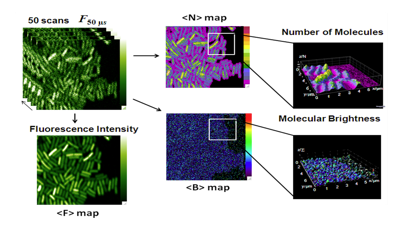
Number & Brightness : N&B was develop by Digman M. and Gratton E. You can refer to the PDF file here explaining the theory of N&B. (http://www.lfd.uci.edu/workshop/2009/files/LFDWorkshop2009-Lecture05.pdf).
The moment analysis is based on the determination of the average intensity (1st moment) and the variance (2nd moment) of the fluorescence intensity fluctuation within the raster scan images. The sampling time must be faster than any diffusion time of the studied system. Given 2 series of equal average fluorescence intensities, the larger is the variance, the less molecules contribute to the average (see figure below).
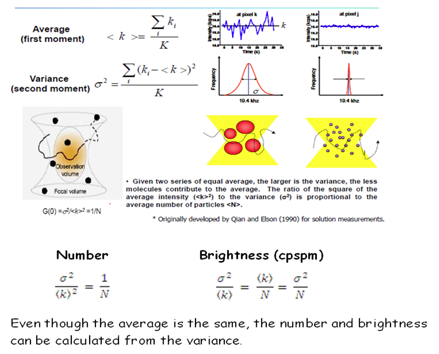

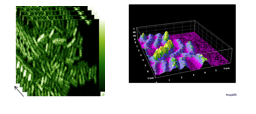
The analysis provides a map of number and a brightness for every pixel in the image.